How to save data in the User DAQ
General Concept
All Data which is important for the experiment is saved by the users ON DEMAND in the FLASH DAQ system. To record this type of data we have 3 User DAQs at FLASH1 (FLASH1_USER1,FLASH1_USER2 and FLASH1_USER3) and two at FLASH 2 (FLASH2_USER1, FLASH2_USER2)
How to save this experiment related "User-Data" will be explained briefly in this page:
In addition, a large number of parameters is continuously saved (pulse energy, arrival time, Beamline settings ...) in the PHOTONDIAGNOSTIC FLASH DAQ system as backup.
Taking User data: Starting and stopping runs (Users)
In order to save the experiment related data from ADCs, Images, delayline detectors etc. the User DAQ has to be started to record the experiment data. The options which data can be saved, have to be discussed way before the beamtime. For regular beamtime operation the DAQ also was setup by experts before the beamtime. If things do not look like described here look in the troubleshooting section below.
DAQ control panel
To get to the User DAQ control one has to go to Experiment control -> User DAQ tab -> FLxUSERy DAQ CTRL


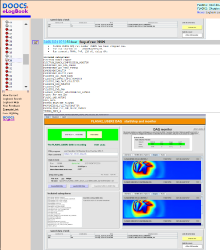
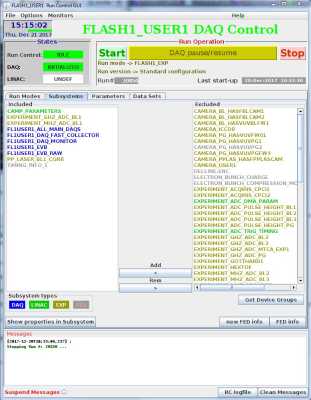
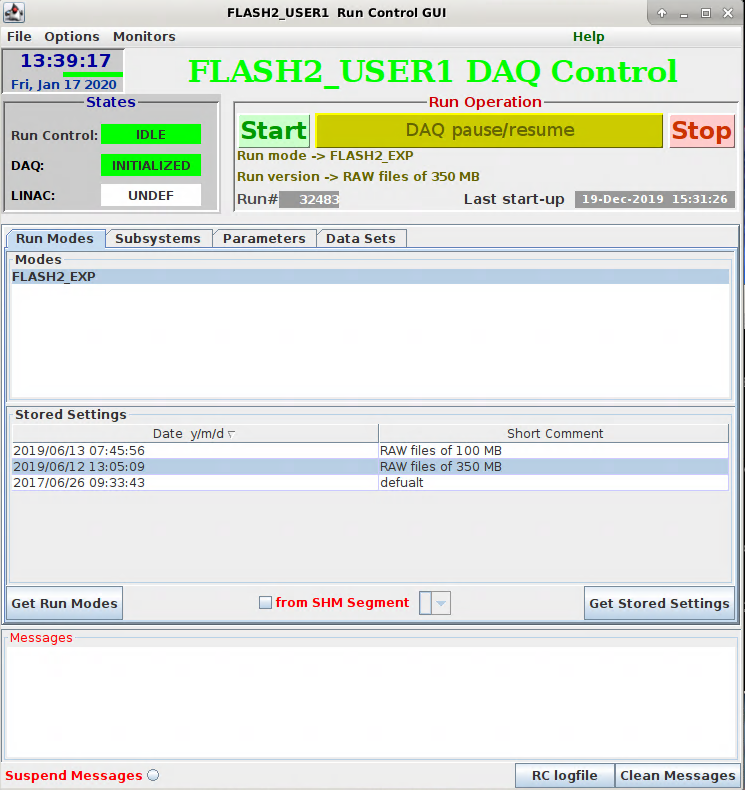
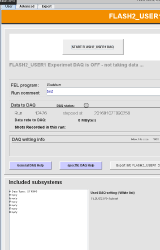
The following window opens. Here the User DAQ can be started and stopped as well as the incoming data can be visualized, information about data rates and saved properties is presented as well as the panel is automatically printed in to the logbook:

- By pressing the start and stop button, besides sending the commands to the DAQ the button prints the panel to the respective beamline / experiments logbook. Here you can later on keep track of the runs. Links to the Beamline logbooks can be found here.
- here a sample entry in the logbook. The run number, "run comment" and several other parameters are printed as (searchable) text in addition with the screenshot of the DAQ control to get all relevant data for this run in the logbook:
- NOTE: After starting, the stop button appears only after saving abut 200 shots to prevent too early stopping which may disturb the DAQ.
- NOTE: Each run has a unique run number. This number is needed to retrieve the data later on. So it is important to keep track which number is associated to what experimental parameters. Note that the run numbers are used by all FLASH DAQs (currently about 10). It might thus well be, that two consecutive runs from you do have run numbers which are spaced by more than one if another DAQ has been started in-between ...
Checklist for proper saving of the data
- Check that some 20 seconds after starting a run the DAQ control shows that the internal checks did not show errors -> the DAQ traffic light is green (... still there may be undetected problems !!!)
- The number of shots has to count up with 10 Hz
- The data rate has to be the same as for the other runs with the same settings (one may click on the number to open a window with the history of the data rate to compare)
- The file size of the file in which the data is written has to increase with the same speed as for the other runs with the same settings
- check the data shown in the DAQ monitor.
- are all required channels shown ?
- is the range set correctly ?
- does the ADC trace, image ... look as expected ?
- are the images, ADC traces ... UPDATING ? (depending on the setting typically the display update is about 1 Hz)
- Are the selected channels checked with the offline monitor (lower part of the DAQ control) saved with ~ 100 % for fast - 10 Hz- properties (and about 10-20 % for slow values saved only ~1 per second)
- Is the time shown in the offline monitor the actual time? (Otherwise it did not read the current files and shows old data !)
- And finally the ultimate check is using the DAQ Data GUI to look at the saved data - this should be done once in a while to be sure that the data is saved correctly
If not all points of the list are o.k. there may be some problem with the writing of the data. Look to the troubleshooting section and / or talk to beamline stuff.
More infos on the tools to check the proper saving of the data
DAQ monitor
The DAQ monitor shows a predefined selection of parameters as they are received in the DAQ before writing to a file. Here one can check if the desired data arrives in the DAQ and if the ranges are set correctly (e.g. sufficient acquisition time). The parameters to look at are defined before the beamtime with the local contact / DAQ group (details see below)
Offline DAQ monitor
This tool looks if a predefined selection of parameters is saved in the raw file. When a raw.-file reached its maximum size ( ~ 1 GB) it is closed and a new file is opened. Once closed, the Offline DAQ monitor reads the file and checks if there are entries for the selected parameters. It shows the fraction of events containing data. For “fast” data (data written with 10 Hz and bunch ID synchronous like images, ADC traces) this should be close to 100%. For “slow” data (saved about every second e.g. pressures , temperatures...) this is about 10-20%. However it is to note that this program just check if there is anything saved. It does not check if it is the proper data.
DAQ Data GUI
To ultimately check if the correct data is saved one can use the DAQ data GUI to look at the saved raw. files.
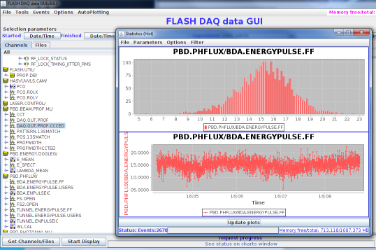
The DAQ Data GUI is a general tool to select and visualize data that was saved in the DAQ . It has in addition simple analysis options like histogram, mean, min or max values as function of time etc. Also correlations between different parameters can be analyzed in the tool. More details can be found How to Use the FLASH DAQ Data GUI? and here (DAQdataGUI link collection)
The tool (separate Java program) can be started DAQdataGUI or in the DAQ control panel ( lower right) on your local user console (Linux or Windows) or log onto the Control machines: flashlxuser1,flashlxuser2 or flashlxuser3 (there you also may start via DAQdataGUI from the command line).
To access the desired data one has to:
- enter the run number of the run you want to look at at Run
- select your DAQ in the Experiment drop down menu: FLASHy_USERx
- press get Channels/Files
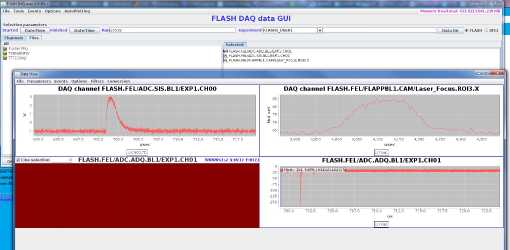
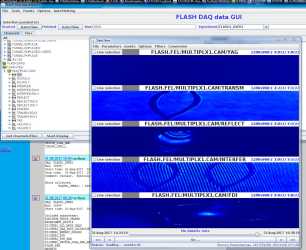
- browse through the data tree and select your important parameters and drag them with the mouse in the selected window. The list of important parameters should have been defined before the experiment with the FLASH stuff together. This list can also be found in the offline monitor (lower part of DAQ control) )
- press Start Display to open a new window with your data. In case it was a long run and / or a large amount of data per shot one can limit the number of shown events to a fraction: Events -> Reading Options -> Event Interval provides the option to show only every n th dataset.
How to get the data out for analysis (short summary)
The DAQdataGui is a powerful tool to visualize the saved data and to do very preliminary analysis. however for more detailed analysis the data has to be read into analysis programs ( matlab, python, Origin ...) here are different options one can use (what option is the best and how to set it up has to be discussed before hand with the FLASH DAQ experts ...)
- The FLASH DAQ system records the data in binary " .raw " files.
- reading the .raw files directly via Python, or via Matlab (no longer recommended) works, yet not for all data types equally well, and needs precise knowledge of the desired Parameters (useful to have a quick look / preliminary analysis on few parameters).
- Note that the raw data is only accessible from certain computers within the DESY network and thus not very handy for offline analysis later on ...
- To ease the data analysis we IN ADDITION provide ON REQUEST the data from the FLASH DAQ as HDF5 format
- ONLINE HDF5s: Intro to the HDF5 structure used at FLASH. This contains also a list of the most used Parameters saved at FLASH for analysis - including the HDF5 names, DOOCS and DAQ names ...
- Examples and an API to make use of the online HDF5s
The HDF5 files (online and summary) are saved in the "gpfs" system . it can be accessed from Windows and Linux computers at DESY by the persons ( logins) which are registered for the beamtime in DOOR ( functional accounts
The path to your data is structured the following way:
- /asap3/flash/gpfs/ beamline used / year /data/ Beamtime application number /raw/hdf/ (the Beamtime application number can be fund in the pdf schedule sent around by Rolf ...)
- as example: /asap3/flash/gpfs/bl2/2017/data/11003163/raw/hdf/
More details and links can be found in the DAQ and controls overview.
Setting up the DAQ - DAQ Run Control GUI (local contacts, FLASH stuff)
This section is intended for the local contacts / FLASH staff to set up the DAQ according to the needs of users before the beamtime. For troubleshooting this may also be helpful for users ...
Configuring the DAQ
Using the jddd DAQ control panel one can start and stop runs but in order to configure the DAQ which data to save one has to use a a separate *DAQ run control * java application. Since it needs write access to DOOCS internal file systems, which can not be made available elsewhere one has to start the system on our linux user consoles at the beamline or on the DOOCS control computers flashlxuser1.desy.de, flashlxuser2.desy.de or flashlxuser3.desy.de.
Log in with the beamline account (bl1user, bl2user, ..., fl24user...) either via fastX3 or Remote desktop from windows or via ssh from Linux machines.
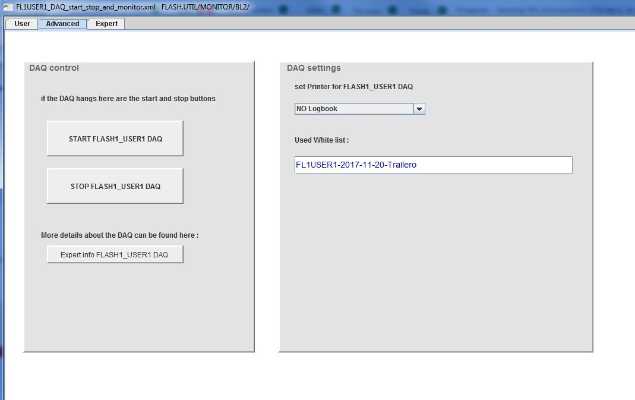
Once logged in to flashlxuser1,2,3 the DAQ run control can be started in the "advanced" Tab of the DAQ control :

Or in the command line:
Unix command | DAQ |
RCGUIFL1USER1 | FLASH1_USER1 DAQ |
RCGUIFL1USER2 | FLASH1_USER2 DAQ |
RCGUIFL1USER3 | FLASH1_USER3 DAQ |
RCGUIFL2USER1 | FLASH2_USER1 DAQ |
RCGUIFL2USER2 | FLASH2_USER2 DAQ |
Which DAQ to use is decided by the FLASH DAQ team according to the beamtime schedule.
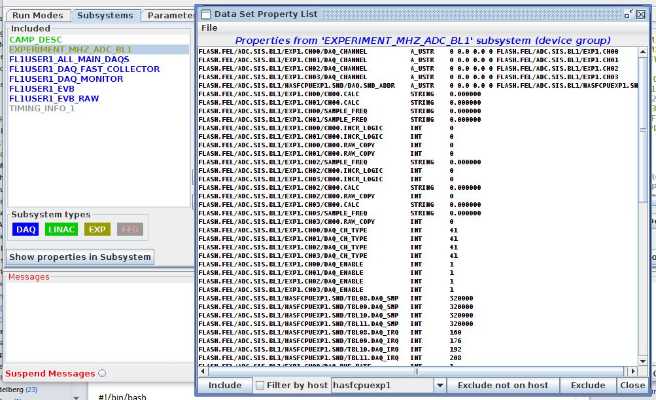
Using the Add and Rem(ove) buttons one can move the desired "subsystems" in the included side - meaning that they are saved. The "subsystems" contain typically several DOOCS parameters. E.g. EXPERIMENT_MHZ_ADC_BL1 contains all relevant DOOCS properties of the four MHZ ADC channels available at BL1. To get a detailed information about the saved parameters one can have a look to the "Show Properties in Subsystems" button . In addition, a list of all possible subsystems and their description can be found here.
Configuring the DAQ monitor
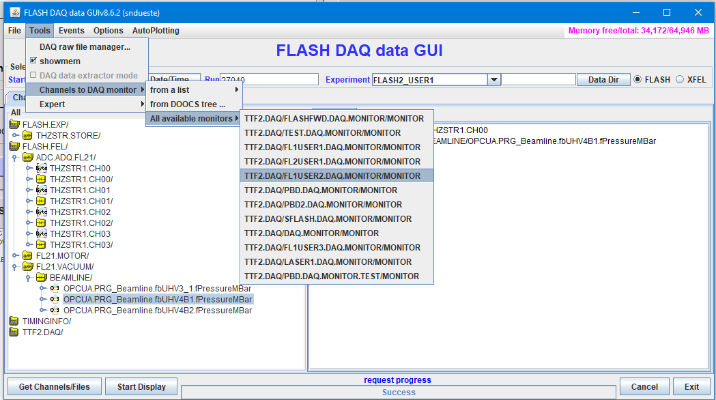
The DAQ monitor ( and the Offline monitor) can be configured using DAQdataGUI.
Load a test run containing all relevant properties. Select all properties you want to monitor. Use Tools -> Channels to DAQMonitor and choose your DAQ. This sends a list with the selected properties to the DAQ monitor of your system.
Start and Stop a run
In order to "activate" and test your configuration you have to start a run with the new configuration. NOTE: Whenever the configuration was changed with the RCGUI the new run HAS to be started with the RCGUI (starting with the jddd DAQ panel would only start the last configuration that has been running before !!!
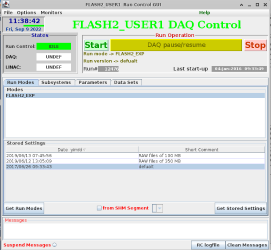
To START a run - meaning starting to save the experiment related data - one has to press the "start" button in the Run Control GUI. This opens a confirmation window asking if you really want to start the run ("in default mode"). Press yes. Now it takes about 20 seconds for the system to start up and start recording data. Indication is the "Run Control: RUN" and "DAQ: RUN" greenish indicators on the upper left side of the run control.
To STOP a run one has to press the "stop" button. This opens a window for comments. This contains already the actual Experiment name by default. Please leave this information in. Add a comment for your run. This comment will be printed into the logbook and can later on be used to identify individual runs ... note you are required to type in something otherwise the run will not stop.
The stopping also needs about 20 seconds.*_IT IS IMPORTANT_ not to start and stop the DAQ while it is still ramping up or down. So please wait before restarting the DAQ.*
After the run use the DAQ data GUI to check if the data intended is saved properly.
Load/Save the configuration
Once a list of subsystems is defined and tested this parameter combination should then be saved in a so-called white list. By loading this white list one can then easily configure the DAQ after changes / restarts ... to the initially defined settings to save the correct data.
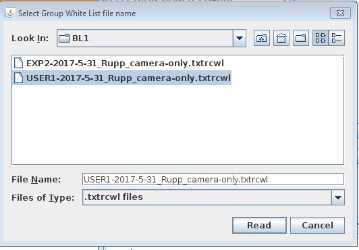
The whitelist can be saved/loaded with the Run Control GUI by: File -> Group White List -> Save/Load. Note, while the top left rectangle's background of time and date is yellow, don't try any further controls of the GUI, you might confuse the program. It is busy reading the configuration from the run control database. The background changes back to grey when it has finished.
The filename convention for the White Lists are arranged in the way:
DAQ name - Date of creation - name of the PI / Experiment - optional comment on the type of data
The whitelists are stored in separate folders for each beamline.
Choosing the file size
The DAQ writes into a file (in .raw format) up to a configurable value. If the limit is reached the file will be closed and a new file will be started. Thus a run can contain tens to hundreds of files.
The size can be configured to be 100 MB, 350 MB or 1000 MB (default)
Few things to consider (in case of doubt talk to the expert (Erland ...)):
- 1000 MB: This is the standard setting which is best for archiving (few large files are preferred). However mainly for images that are saved with less than 10 Hz the HDF5 converter has problems with the large files. And for low data rates it may take upto half an hour to fill one 1GB file. Then smaller ones are also preferable.
- 350 MB: Often a good compromise ...
- 100 MB: It is not preferred to have many "small" files for storing the data. For very small data rates this is an option to not wait too long till the next file is created.
To choose the desired file size one has to choose a run mode configuration in the RunControlGUI
This will however the clear the definition of selected subsystems and one has to reload the whitelist of the experiment again.
Assigning the DAQ to the beamline in jddd
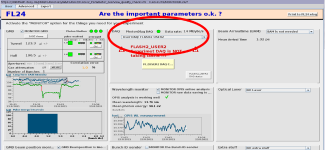
To assign which DAQ is used at what beamline one has to use the dropdown menu in the parameter monitor. In each Beamline overview tab (BL1,2,3) there is a button (upper right) that starts the parameter monitor panel. In the upper middle is a DAQ field in which the appropriate DAQ can be assigned to the Beamline.
Setting the logbook to print in / putting the Whitelist name in jddd
The jddd DAQ Control should be set up that it prints by default the relevant run information in the logbook associated to your beamline Logbooks
Define logbook / and whitelist for display in the jddd DAQ control (jddd otherwise does not "know" which White list was used ... this has to be put in by hand ...up to now)
In case something goes wrong: Troubleshooting
No START or STOP buttons are visible in the DAQ control panel
The jddd GUI only shows the Start and stop button if the DAQ is in the "Idle" state. Sometimes the DAQ "just" gets stuck in the stopping phase. Then stopping again or starting form the not "Idle" state can help. For this goto the "Advanced" tab of the jddd DAQ control . there the START and STOP buttons are always available ... independent of the state of the DAQ. If this does not help you may have to restart the DAQ ...
The DAQ does not start a run
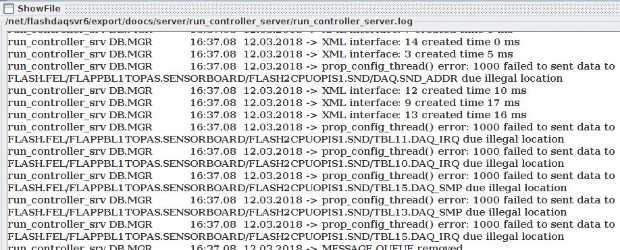
- Mainly the DAQ works fine but one of the properties that should be saved is not available or somehow corrupted. There the RC logfile helps (see below) to determine where to localize the problem. The pragmatic way is to exclude the subsystems which may contain the properties with problems. Thus exclude the "critical" subsystems. Start a run (starting with the RCGUI not with jddd DAQ control ). If this works, include one by one the excluded subsystems and start runs. That way one should find out which subsystem causes the problem. Now one can investigate this one in more detail. Is the property available in DOOCS? Does it update? maybe restart the server providing the property ...
as example: 
Data seems not properly saved
When checking the saved run with the DAQdataGUI it may happen that the property shows up in the data tree but no events are saved. Then (most likely) something is wrong with the sending of the data.
- A very helpful tool is the RC logfile. in the RCGUI on the lower right side there is a button to start an editor with the log file. besides lots of standard entries there is usually also a hint on where to find the problem ...
- check if the device is working properly. Is it connected? Can you see data in jddd / DOOCS ? . If not you have to fix the DOOCS part ... DAQ can only save what is properly implemented in DOOCS.
- If camera images are not properly saved ( e.g. only "0"s in the image matrix or the DAQ sender can not be switched to "on") a restart of the camera server usually helps.
- Sometimes also a restart of the DAQ (see below) helps ... This however is more the case if the DAQ does not start at all or saves no data at all ...
- in several cases the reason is a configuration problem of the server. Then 2 servers are sending on the same "address". Then one property usually is saved without loss while the second one is only saved once in a while ( 1-5%). Here the server has to be fixed. As fast cure one can only exclude the less important subsystem and save the more important properly ...
Restarting the DAQ
- If the RCGUI does not respond (and also the clock display does not count up) one has to restart the GUI. Usually the DAQ is not affected by the RCGUI hang up ...
- Generally there 3 ways to "restart" the DAQ
- 1. The least interfering way is the "all to INITIALIZE" that tries to reset the DAQ processes ... helps for simple "hickups"
- 2. The "re-start DAQ" really reboots the whole DAQ process. The settings still should be as before ... this is the "Usual" restart
- 3. In very hard and severe cases there is the ultimate restart button: "re-start DAQ (no RCSHM)"
Here in more detail:
- if the DAQ gets stuck in the starting or stopping procedure one can try to initialize the DAQ or in the worst case restart it.
- to be able to restart the DAQ one has to run jddd on Linux in the DESY network, meaning wither on our User consoles in the Experimental halls (cons0...12) or on flashlxuser1,flashlxuser2 or flashlxuser3. Log in at one of these machines with your beamline account (e.g. bl1user or fl24user). (On the flashlxuser machines there are no desktop icons to start jddd. Here you can use the shell command: flash -> Click on "Photons" -> "Photons main panel" )
- To Restart the DAQs you need the "expert" Tab of the User DAQ control panel.
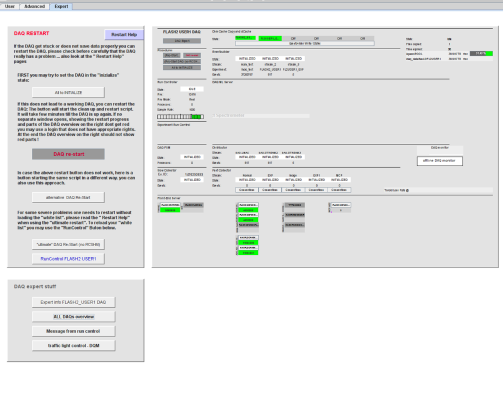
There is some description of the different ways to restart the DAQ in the panel:
all to INITIALIZE
- First, one may try the "all to INITIALIZE" button. It starts a script window showing the progress of the initialization. The script sets all subcomponents to initialize. It is helpful if one subcomponent got stuck.
- If there is no window coming up or closing right away there may be a problem with the rights. In this case you:
- may try to login at the flashlxuser machines and try there again
- or use the red "DAQ restart" Button one below. This button reacts technically different and can circumvent rights problems ...
Initialize script: 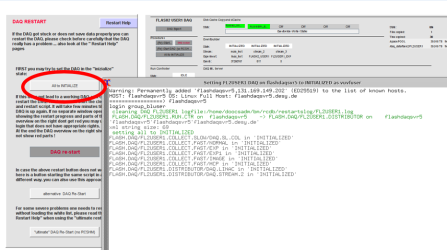 parts of the DAQ are in different "states":
Restart the DAQ
- If the "initialize" does not help, you have to "re-start DAQ". This completely restarts all processes and takes a while. A script window appears and shows what steps are actually done. At the end is sais: "Cleanup finished".
- There are actually 2 buttons to "restart" the DAQ. They start the same restarting script - however in different ways. Thus, if one for what ever reason does not work with your configuration you may use the second one ...
Script window: 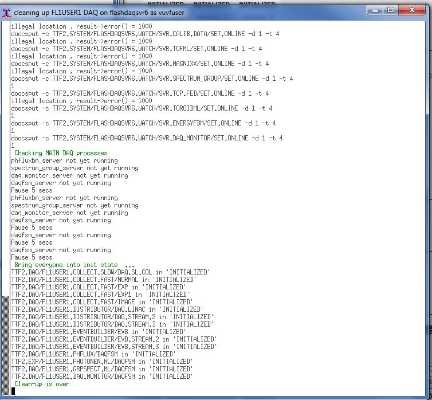 Restart:
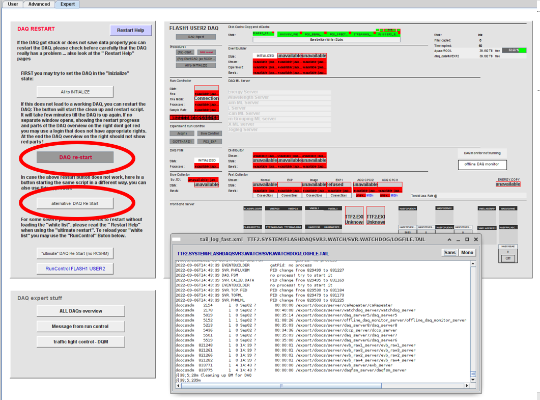
- For the "re-start DAQ" the DAQ should come up in the same state as before. Meaning that the subsystems (ADCs, cameras ..) are still loaded and displayed. If this is not the case you can try to load your white list and start a new run. If the data is saved correctly you are done.
"Ultimate" restart
- IF the DAQ still does not work properly the final option is the: " "Ultimate" re-start DAQ (no RCSHM)". This button does the same as the "re-start DAQ" but the Run Controller shared memory is not re-stored. It means that after the DAQ is back no run configuration is selected.
- in the jddd control the list of subsystems sais "empty"
- and you have to reload the parameters to be saved from the Whitelist.
- you can use the "Runcontrol" button right below the "Ultimate" re-start DAQ (no RCSHM)" to start the RunControl window
- choose the files ize ( best default: 1GB)
- goto "Subsystems" tab and load your Whitelist
- and start a run ...
- in the jddd control the list of subsystems sais "empty"
- If there are still components not working after the "re-start DAQ (no RCSHM)" you have to call the photon coordinator (4455) and pray ...
Some more details for experts ...
Re-read the data base
If there are new Properties included by Vladimir et al one has to reread the data base.
This can be done easiest by going to the run modes and choose a different "stored setting" (changing e.g. from filesize 100 MB to 350 MB) and going back to subsystems. At this point the new database entries are read in. then one can do the same backwards to switch back to the initial file size. Doing this the configured list of subsystems is lost and one has to reload the whitelist and start a run to get the loaded whitelist in the configuration.
OR one can do the hard way:
On flashlxuser1,2 or 3 start RCGUIFL1USER1 or appropriate to the DAQ you want to reconfigure. Select the tab "Run Modes". To then reload or re-init the run control database you need the expert menu entry:
Then you go to "Expert" -> "Run Control Commands" -> "Remove SHM" (occasionally twice).
After you see a message in the RCGUI messages window that the SHM was removed you do:
Now close the RCGUI and start it again. Switch to the tab "subsystems", wait for the subsystems to be reloaded and load the whitelist you want to use.
Tracking DAQ restarts
A system was implemented (March 2020) where each restart of a user DAQ is recorded in a log file
One can see all log files in :
/home/doocsadm/bm/rcdb/restartslog/
data base errors
The red flags next to the different stream indicators tell something about data base errors

upper flag: There was a problem to read run catalogue
lower flag: There was a problem to read dccp catalogue.
In both cases there are counters of failures to read a catalogue. If this counter is not incrementing with every attempt to read a catalogue, then it's no problem. It can be monitored and reset in the panel that one gets by pressing on "green" area.
raw writers
(all user DAQs are using stream 2) 
what raw writers are used ? ... They are defined in FLASH.DAQ/FLxUSERy.EVENTBUILDER/EVB.STREAM.2/EVB.ROOT.SRVRS as XML string
what is the current raw writer? ... FLASH.DAQ/FLxUSERy.EVENTBUILDER/EVB.STREAM.2/CUR.RAW.WRITER
OR
one can have a look at the Offline monitor :
FLASH.DAQ/FL1USER1.DAQ.OFFL.MONITOR/MONITOR/LAST.FILE
FLASH.DAQ/FL1USER1.DAQ.OFFL.MONITOR/MONITOR/CUR.WRITER